Galaxy k-correction Estimation using AstroCLIP Foundation Model

Introduction
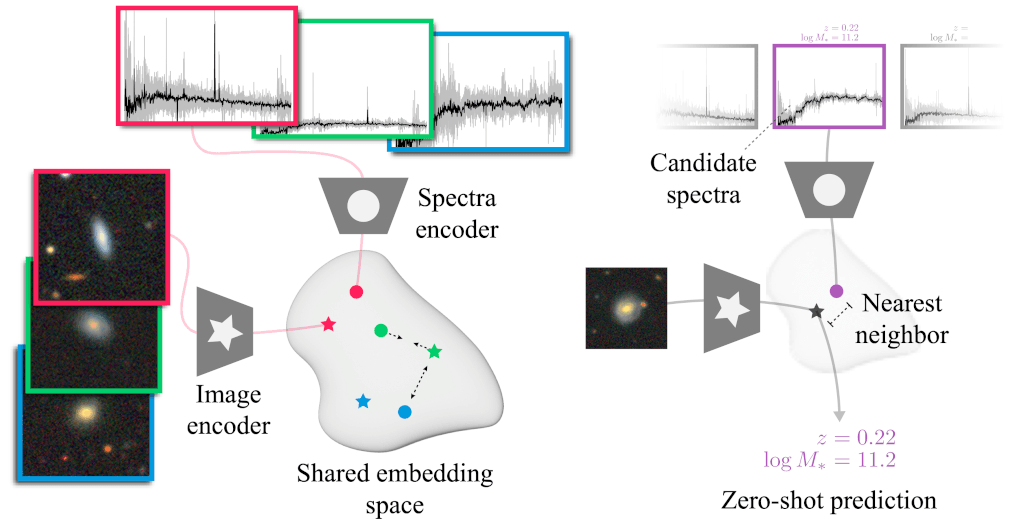
Foundation models are transforming machine learning, setting new benchmarks across industries by leveraging their ability to learn patterns from huge unlabelled datasets. Earlier this year (2024), AstroCLIP was introduced: a multimodal foundation model trained on millions of galaxies. AstroCLIP maps both galaxy images and spectra into a shared, richly expressive k-dimensional embedding space, enabling a wide range of applications from redshift estimation to morphology classification.
Building on AstroCLIP’s capabilities, I set out to tackle a novel challenge: predicting galaxy k-corrections directly from galaxy images. K-corrections are critical for deriving intrinsic galaxy properties, but traditional methods are only able to provide gross estimates if spectroscopic data is not available.
This project bridges the gap between astrophysics and modern machine learning by developing a method that fine tunes AstroCLIP to predict k-corrections. To achieve this, I experimented with multiple approaches including zero-shot learning and few-show learning, harnessing the rich latent representations learned by the foundation model.
To my knowledge, this is the first approach to accurately predict k-corrections from galaxy images. My model achieved a score of 0.87 on a 150,000-galaxy dataset from DESI-EDR, surpassing the SOTA estimates calculated by Blanton's method.
Data and task definition
Astronomy is a field rich with data, and modern surveys like DESI generate vast datasets from countless celestial objects. In this project, we'll focus on galaxies and explore how machine learning can help address a long-standing challenge in astronomy: calculating K-corrections.
Galaxies can be studied through three primary types of measurements:
- Spectra: These are detailed measurements of a galaxy's light broken down by wavelength.
- Images in different bands: These capture the structure of a galaxy across specific ranges of wavelengths.
- Photometry: This refers to the total light collected from a galaxy in each band, offering a simpler but less detailed view than spectra.
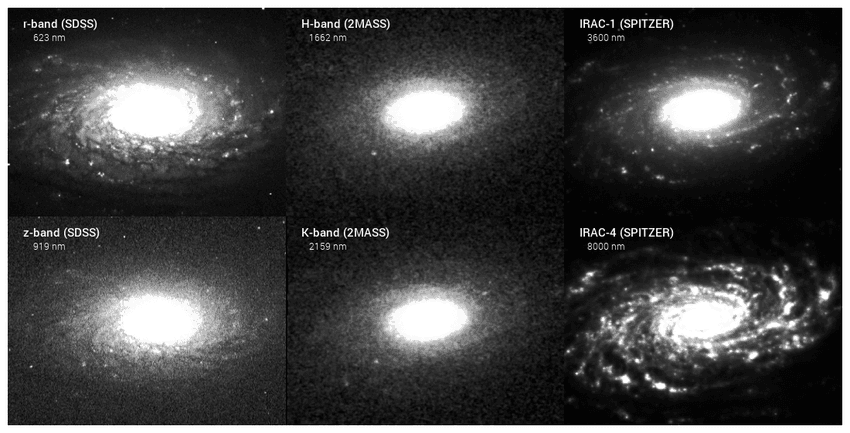 Images in different bands of Galaxy NGC 5055
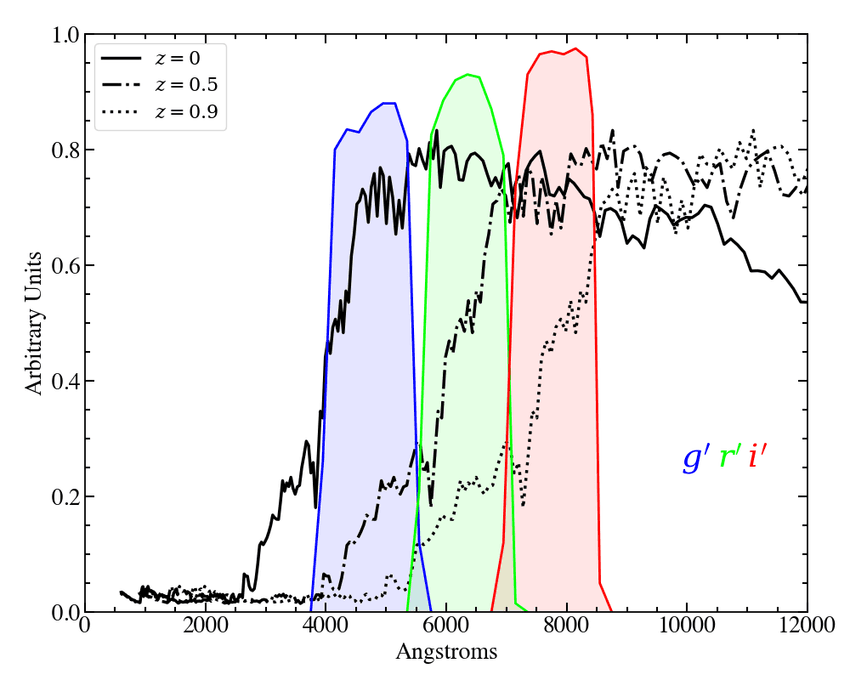 *A galaxy spectrum (black line) with three overlaid band response functions (colored curves). Each band has an associated photometric measurement. *
What is the K correction?
Given a specific photometric band R, the K-Correction K_{R,R} is a real number that adjusts for the effect of the universe's expansion on the light we observe from galaxies.
When spectra are available, K-corrections can be calculated analytically, see Hogg's 2002 paper:

However, spectra are often expensive or hard to get. In such cases, astronomers rely on photometry-based methods like Blanton's K-correction, which, while standard, can be inaccurate—particularly for distant galaxies.
Leveraging ML for K-corrections
This is where machine learning can make a significant impact. By leveraging a foundation model pretrained on 76 million images and spectra, we can develop a novel method to estimate accurate K-corrections directly from galaxy images. Since images are far more accessible than spectra, this approach has the potential to become an invaluable tool for astronomers working with large datasets.
For this project, I used a subset of data from the DESI Early Data Release, which includes the following quantities for about 150,000 galaxies:
- Astonishingly high-resolution spectra, represented as a
1x7780array. - Galaxy images in DESI bands g, r and z, represented as a
144x144x3array. - Redshift
z, a single Real number for each galaxy. - K corrections estimated by the value added catalog FastSpecFit, predicted from spectra and therefore highly reliable.
The goal of this project is to predict the galaxy K corrections given the galaxy images. It is therefore a supervised learning regression problem.
Data visualization and preparation
The code and instructions to reproduce these experiments can be found in my github.
Inspecting the original dataset
The original dataset, downloaded from DESI-edr release and exported by AstroCLIP authors in hugging face format, has exactly 197976 galaxy samples, split into train (0.8) and test (0.2) datasets. In this notebook you can find the code I used to visualize the data.
This is what the spectrum and images of an individual sample in our dataset look like:
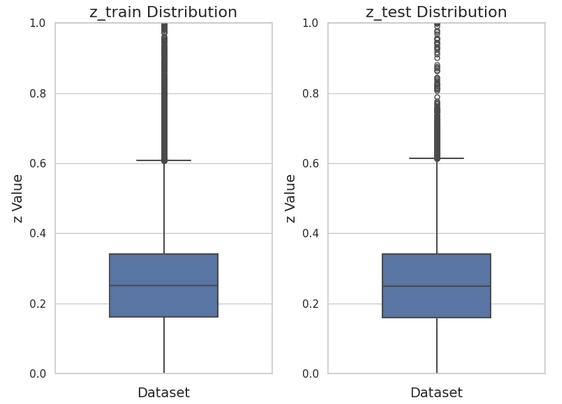
 It is informative to inspect the distribution of the column redshift (
z) across our galaxies:
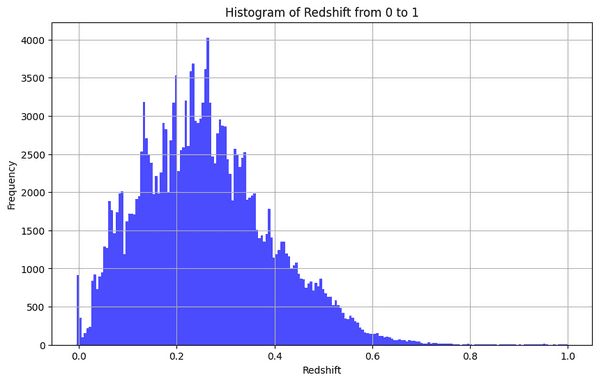 This gives us an idea of the distance of the galaxies we are working with. The bulk of the galaxies are at
 z <= 0.6, which can be considered "nearby" at cosmological distances. Only a handful (~800 samples) are at redshift >1.
As a final sanity check, let's validate that the redshifts are equally balanced across the training and test split:
CInspecting the Target Labels
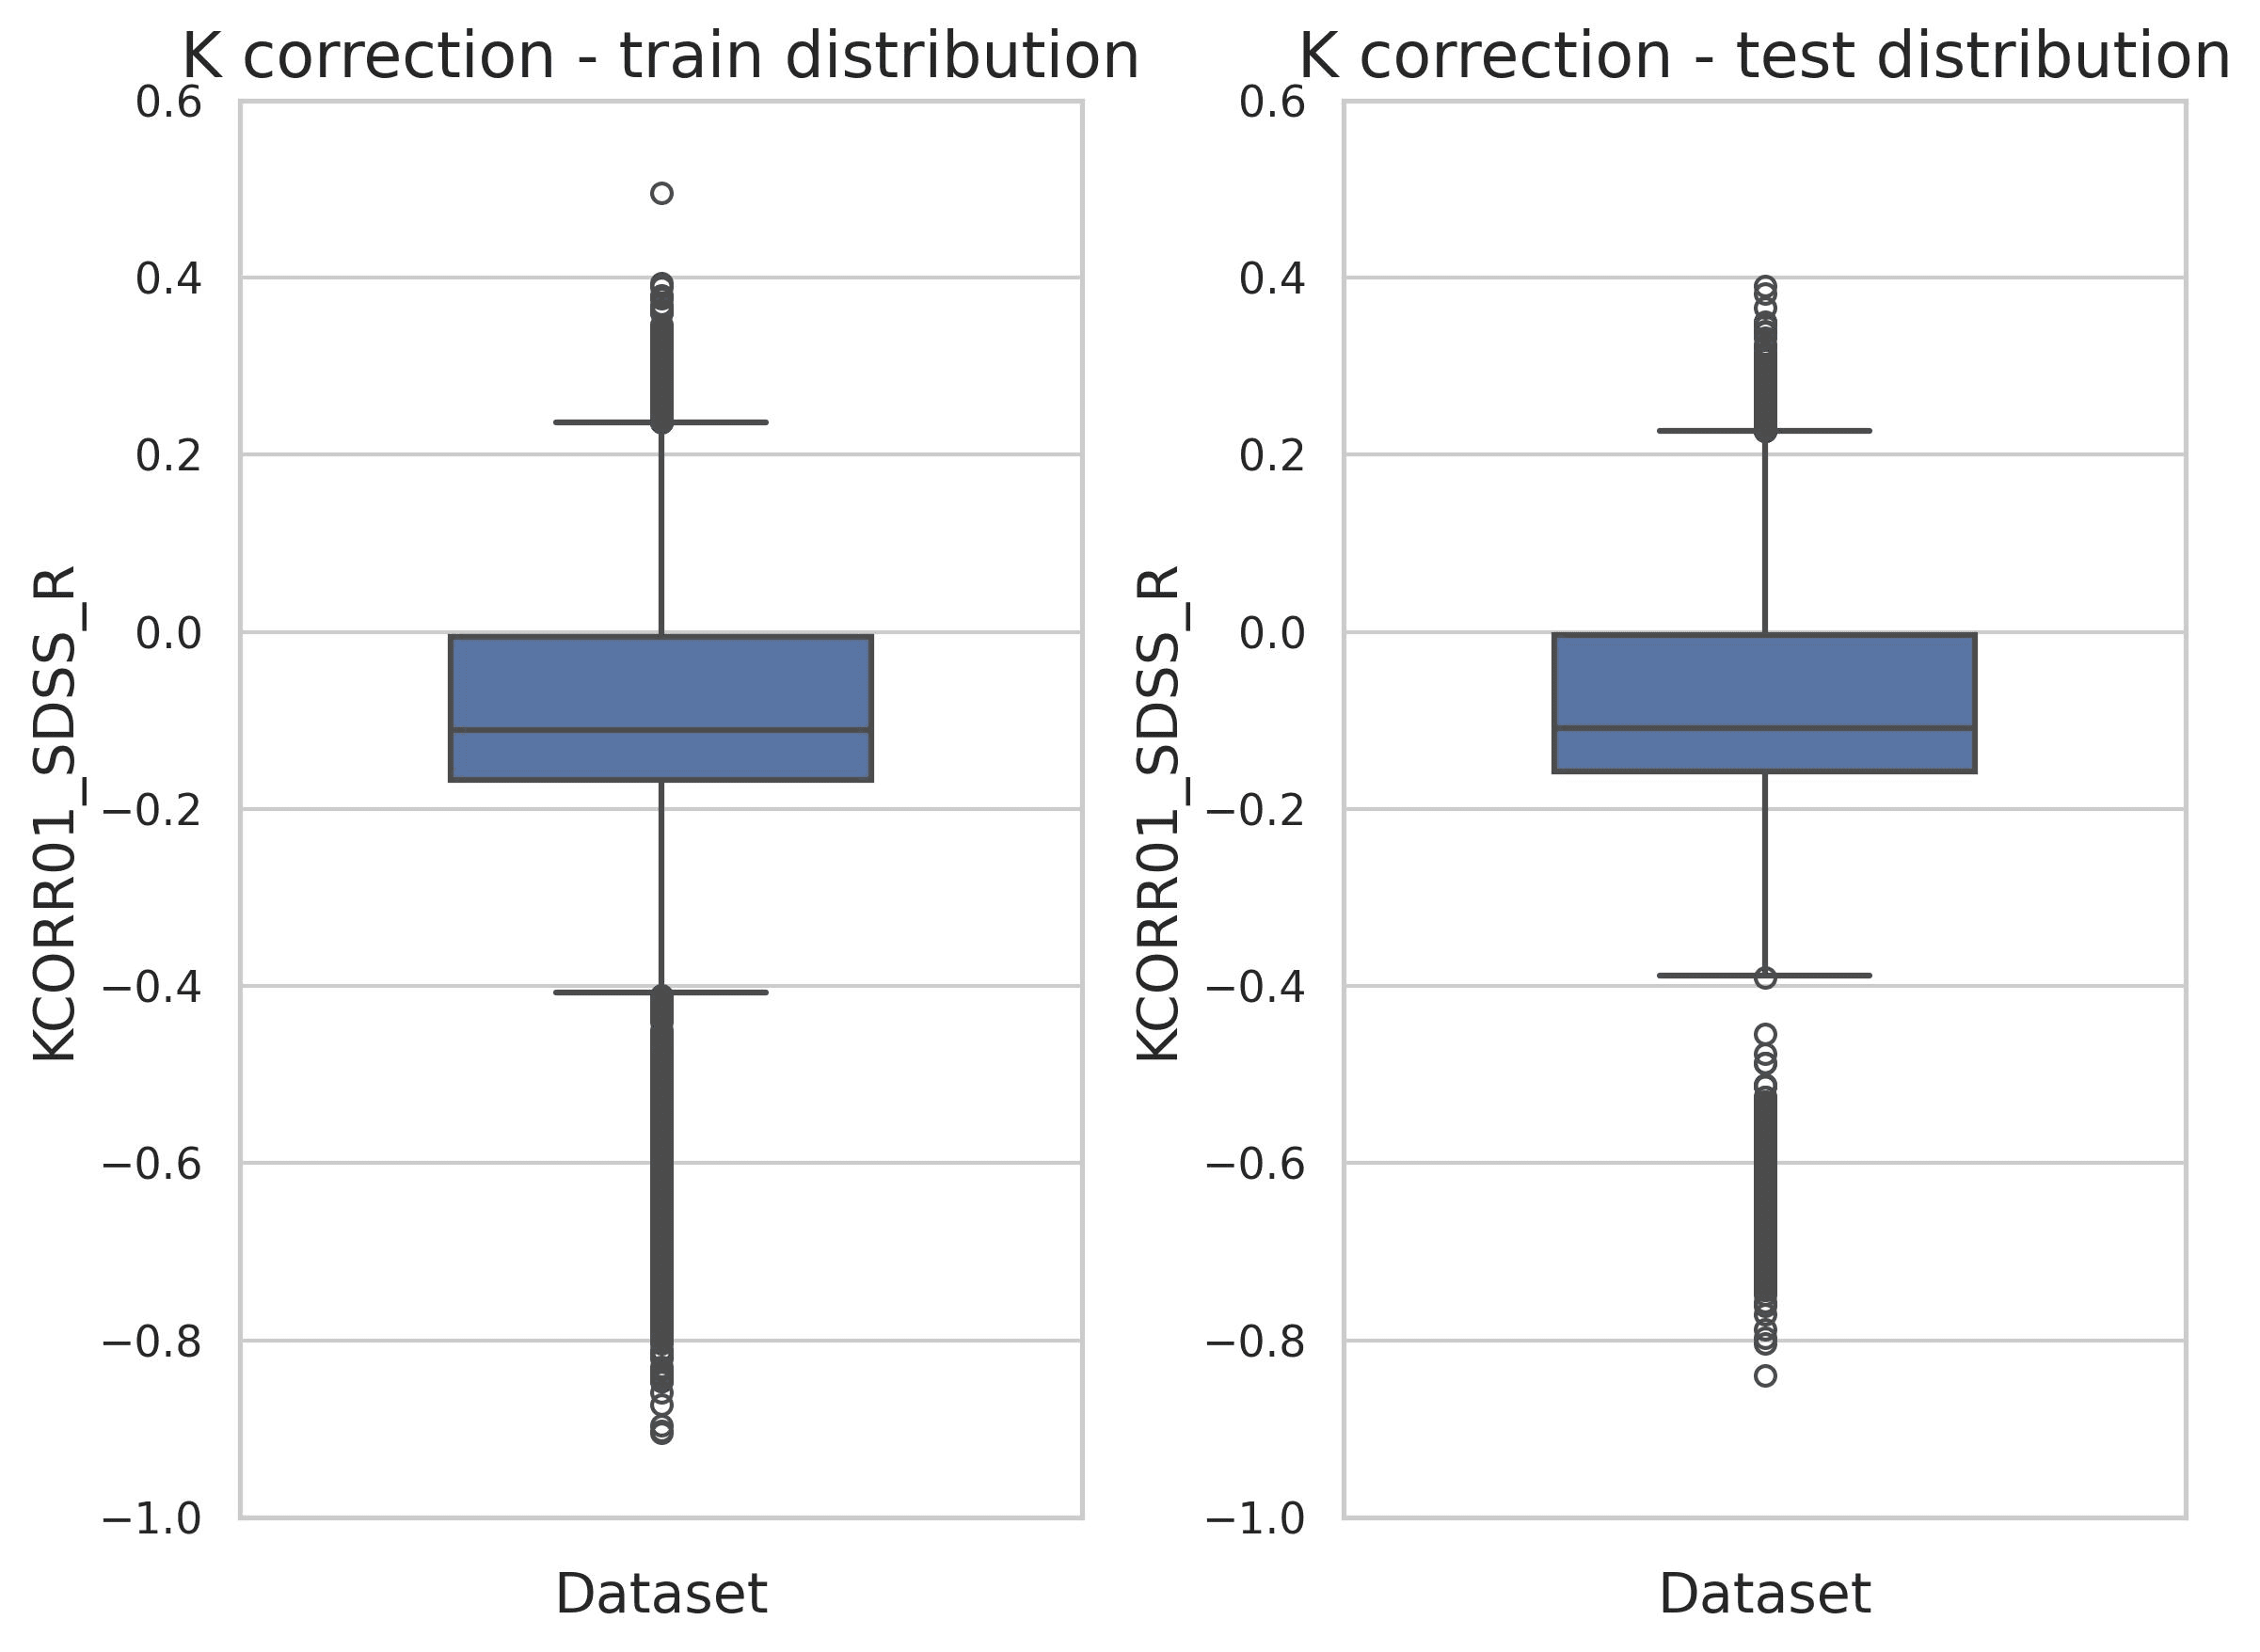
The original DESI data release does not provide K-corrections. However, since the release includes galaxy spectra, K-corrections can be calculated analytically, as done by the Value Added Catalog "FastSpecFit". For the purposes of this blogpost, I will focus on predicting the K correction at band sdss_r with band shift 0.1. Thus, the distribution of our target variable for regression looks like this:
It is also informative to visualize the distribution of the target variable discriminating by galaxy redshift.
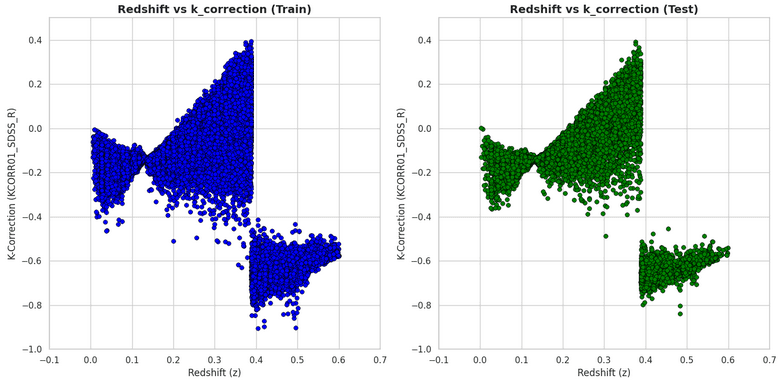
Looking at this plot reveals a clear discontinuity at z ~ 0.38. Interestingly, this is caused by the Balmer jump, and shows us that for galaxies beyond z ~ 0.38 the K correction at band sdss_r is very hard of impossible to predict.
For simplicity, I filtered out galaxies whose redshift is greater than 0.38 ; which is roughly the cut value for band sdss_r.
Extending AstroCLIP foundation model
The AstroCLIP foundation model is huge, involving an image encoder with 307M parameters and a spectrum encoder with 43M trainable parameters. The results of either encoder gets processed by further cross-attention heads and MLP, outputting a final embedding of size 512 for any galaxy (regardless of whether the input was an image or a spectrum).
I leveraged the trained model and mapped every galaxy image from my dataset into a 512-dimensional vector. Each galaxy image is therefore embedded into a 512-D feature space, which will be used to predict the K correction. Checkout embed_astroclip.py for implementation details.
Zero-shot learning
A straightforward approach is to apply K-nearest neighbors in the latent space. This does not require training any additional layers on top of AstroCLIP and works surprisingly well: 0.025 mean absolute error and 0.87 R^2 score for using number of neighbors k=64.
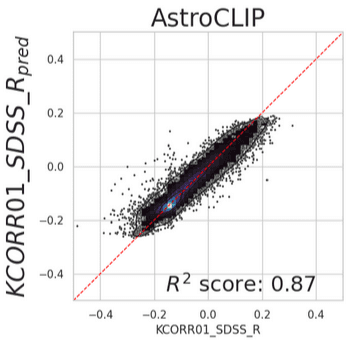
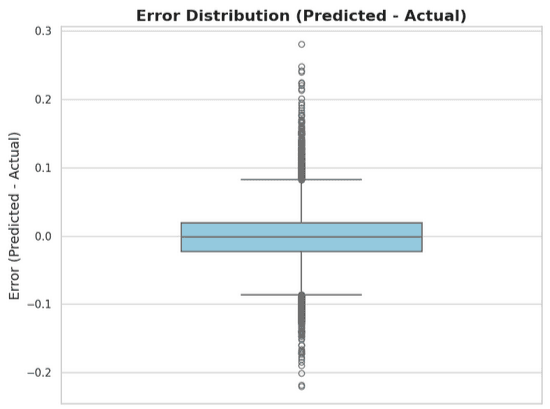
The distribution of the error is neatly centered in zero, with a mean squared error of 0.0427. As shown in a posterior section, this predictor surpasses the R^2 and MSE achieved by the SOTA, non-ML based tool of choice for this task, KCorrect.
DISTRIBUTION OF ERROR HISTOGRAM
The only hyperparameter of this simple approach is the number of neighbors k, which doesn't have a strong impact on the predictor's performance:
Zero-shot lerning has a few key disadvantages, inherited from KNN approach: 1- Poor generalization beyond training data. 2- Inference scales poorly with the size of the training dataset, and this can be particularly harmful in large astronomical datasets.
Few-show learning
A more interesting approach involves adding extra trainable layers at the end of AstroCLIP.
Simple MLP layers
Adding a few dense layers with ReLU activation and Dropout is a popular and simple way to fine tune foundation models for specific tasks. A single hidden layer with 64 units, plus a single output neuron for regression achieves 0.10 MAE and 0.86 R^2 score. This is slightly worse than the KNN approach.
[ FEW SHOT PERFORMANCE IMAGE ]
On the upside, we can actually use dropout layers to produce a confidence score that is actually remarkably good. If we only keep the top 90 percent of most confident predictions, the R^2 and MAE significantly increases:
[ FILTER OUT CONFIDENCE PLOT ]
Complex fine tuning
Given that we have about 100,000 samples in our training dataset, it seems worth trying to fine tune the model by adding slightly more complex attention layers.
[ PLOT WITH RESULTS]
Benchmarking against SOTA
For benchmarking pusposes, I used k-correct 5.1.2, a tool that estimates K-corrections based on galaxy photometry and is the standard approach when spectra are unavailable. Checkout the repo to see how these estimations were generated.
Using FastSpecFit estimations as ground, we can observe that k-correct estimations are generally reliable, although they often underestimate the actual K-correction value.
On the test set, k-correct achieves an R^2 score of 0.83 and MSE of 0.0462. This is worse than the results achieved by the deep-learning approach presented before:
Moreover, k-correct expects extra parameters to be provided such as the redshift value of the galaxy in order to make a prediction; while the fine tuned AstroCLIP is able to make a better prediction only from the images.
Conclusion
This blogpost presented a computer vision model obtained by fine-tuning a multimodal foundation model, that is able to surpass the SOTA, non-ML based software used to estimate galaxy K-Corrections. While the experiments were restricted to band sdss_r and Z < 0.37, a similar procedure can be followed to obtain predictors for other photometric bands and redshift ranges.
With relatively minimal training effort, foundation models enable data scientist to harness patterns learned from vast amounts of data, in this case millions of galaxy images, to solve novel challenges. The training dataset used for this experiment is only the early release, 1 percent release of the total datase that will be available in the near future. I am eager to see how astronomical foundation models evolve with time, and with so much data available, I have no doubt that many achievements will be made.